Investigating popularity of Python build backends over time
Inspired by a Mastodon
post by Françoise Conil,
who investigated the current popularity of build backends used in
pyproject.toml files, I wanted to investigate how the popularity of build
backends used in pyproject.toml files evolved over the years since the
introduction of PEP-0517 in 2015.
Getting the data
Tom Forbes provides a huge dataset that contains information about every file within every release uploaded to PyPI. To get the current dataset, we can use:
curl -L --remote-name-all $(curl -L "https://github.com/pypi-data/data/raw/main/links/dataset.txt")
This will download approximately 30GB of parquet files, providing detailed information about each file included in a PyPI upload, including:
- project name, version and release date
- file path, size and line count
- hash of the file
The dataset does not contain the actual files themselves though, more on that in a moment.
Querying the dataset using duckdb
We can now use duckdb to query the parquet files directly. Let’s look into the schema first:
describe select * from '*.parquet';

┌─────────────────┬─────────────┬─────────┐
│   column_name   │ column_type │  null   │
│     varchar     │   varchar   │ varchar │
├─────────────────┼─────────────┼─────────┤
│ project_name    │ VARCHAR     │ YES     │
│ project_version │ VARCHAR     │ YES     │
│ project_release │ VARCHAR     │ YES     │
│ uploaded_on     │ TIMESTAMP   │ YES     │
│ path            │ VARCHAR     │ YES     │
│ archive_path    │ VARCHAR     │ YES     │
│ size            │ UBIGINT     │ YES     │
│ hash            │ BLOB        │ YES     │
│ skip_reason     │ VARCHAR     │ YES     │
│ lines           │ UBIGINT     │ YES     │
│ repository      │ UINTEGER    │ YES     │
├─────────────────┴─────────────┴─────────┤
│ 11 rows                       6 columns │
└─────────────────────────────────────────┘
From all files mentioned in the dataset, we only care about pyproject.toml
files that are in the project’s root directory. Since we’ll still have to
download the actual files, we need to get the path and the repository to
construct the corresponding URL to the mirror that contains all files in a
bunch of huge git repositories. Some files are not available on the mirrors; to
skip these, we only take files where the skip_reason is empty. We also care
about the timestamp of the upload (uploaded_on) and the hash to avoid
processing identical files twice:
select
    path,
    hash,
    uploaded_on,
    repository
from '*.parquet'
where
    skip_reason == '' and
    lower(string_split(path, '/')[-1]) == 'pyproject.toml' and
    len(string_split(path, '/')) == 5
order by uploaded_on desc
This query runs for a few minutes on my laptop and returns ~1.2M rows.
Getting the actual files
Using the repository and path, we can now construct an URL from which we
can fetch the actual file for further processing:
url = f"https://raw.githubusercontent.com/pypi-data/pypi-mirror-{repository}/code/{path}"
We can download the individual pyproject.toml files and parse them to read
the build-backend into a dictionary mapping the file-hash to the build
backend. Downloads on GitHub are rate-limited, so downloading 1.2M files
will take a couple of days. By skipping files with a hash we’ve already
processed, we can avoid downloading the same file more than once, cutting the
required downloads by circa 50%.
Results
Assuming the data is complete and my analysis is sound, these are the findings:
There is a surprising amount of build backends in use, but the overall amount of uploads per build backend decreases quickly, with a long tail of single uploads:
>>> results.backend.value_counts()
backend
setuptools        701550
poetry            380830
hatchling          56917
flit               36223
pdm                11437
maturin             9796
jupyter             1707
mesonpy              625
scikit               556
                   ...
postry                 1
tree                   1
setuptoos              1
neuron                 1
avalon                 1
maturimaturinn         1
jsonpath               1
ha                     1
pyo3                   1
Name: count, Length: 73, dtype: int64
We pick only the top 4 build backends, and group the remaining ones (including PDM and Maturin) into “other” so they are accounted for as well.
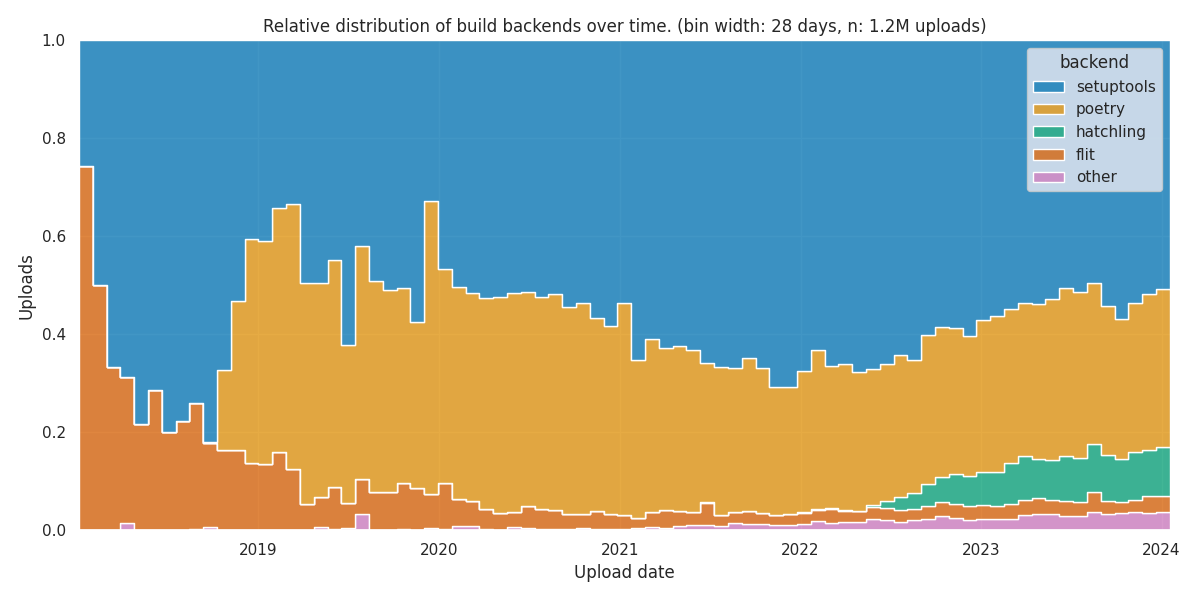
The following plot shows the relative distribution of build backends over time. Each bin represents a time span of 28 days. I chose 28 days to reduce visual clutter. Within each bin, the height of the bars corresponds to the relative proportion of uploads during that time interval:
Looking at the right side of the plot, we see the current distribution. It confirms Françoise’s findings about the current popularity of build backends:
- Setuptools: ~50%
- Poetry: ~33%
- Hatch: ~10%
- Flit: ~3%
- Other: ~4%
Between 2018 and 2020 the graph exhibits significant fluctuations, due to the
relatively low amount uploads utizing pyproject.toml files. During that early
period, Flit started as the most popular build backend, but was eventually
displaced by Setuptools and Poetry.
Between 2020 and 2020, the overall usage of pyproject.toml files increased
significantly. By the end of 2022, the share of Setuptools peaked at 70%.
After 2020, other build backends experienced a gradual rise in popularity. Amongh these, Hatch emerged as a notable contender, steadily gaining traction and ultimately stabilizing at 10%.
We can also look into the absolute distribution of build backends over time:
The plot shows that Setuptools has the strongest growth trajectory, surpassing all other build backends. Poetry and Hatch are growing at a comparable rate, but since Hatch started roughly 4 years after Poetry, it’s lagging behind in popularity. Despite not being among the most widely used backends anymore, Flit maintains a steady and consistent growth pattern, indicating its enduring relevance in the Python packaging landscape.
The script for downloading and analyzing the data can be found in my GitHub
repository. It contains the results of the duckb query (so you
don’t have to download the full dataset) and the pickled dictionary, mapping
the file hashes to the build backends, saving you days for downloading and
analyzing the pyproject.toml files yourself.

