Investigating the popularity of Python build backends over time (II)
Last year, I analyzed the popularity of build backends used in
pyproject.toml files over time. This post is the update for 2024.
Analysis
Like last year, I’m using Tom Forbes’ fantastic dataset containing information about every file within every release uploaded to PyPI. To get the current dataset, I followed the same process as in last year’s analysis, so I won’t repeat all the details here. Instead, I’ll highlight the main steps:
- Download the parquet files from the dataset
- Use DuckDB to query the parquet files, extracting the project name,
upload date, the
pyproject.tomlfile, and its hash for each upload - Download each
pyproject.tomlfile and extract the build backend. To avoid redundant downloads, I stored a mapping of the file hash and their respective build backend
Downloading all the parquet files took roughly a week due to GitHub’s
rate limiting. Tom suggested leveraging the Git v2 protocol to
fetch the data directly. This approach could bypass rate limiting and
complete the download of all pyproject.toml files in just 20 minutes(!).
However, I couldn’t find sufficient documentation that would help me to
implement this method, so this will have to wait until next year’s analysis.
Once all the data is downloaded, I perform some preprocessing:
- Grouped the top 4 build backends by their absolute number of uploads and categorized the remaining ones as “other”
- Binned upload dates into quarters to reduce clutter in the resulting graphs
Results
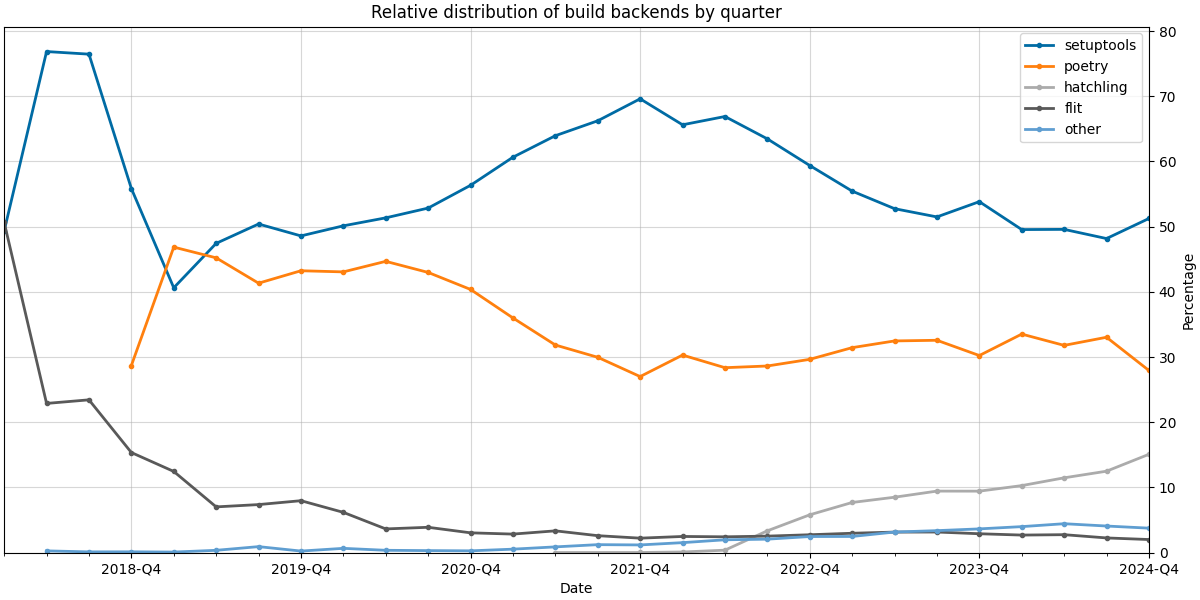
I modified the plots a bit from last year to make them easier to read. Most notably, I binned the data into quarters to make the plots less noisy, and secondly, I stopped stacking the relative distribution plots to make the percentages directly readable.
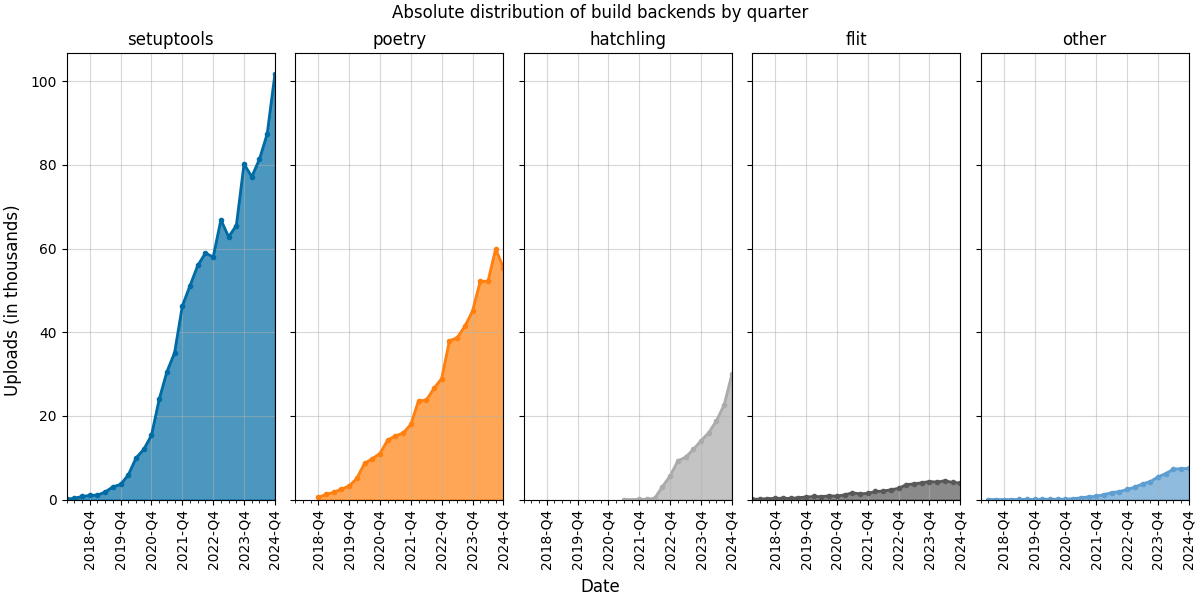
The first plot shows the absolute number of uploads (in thousands) by quarter and build backend.
The second plot shows the relative distribution of build backends by quarter.
In 2024, we observe that:
- Setuptools continues to grow in absolute numbers and remains around the 50% mark in relative distribution
- Poetry maintains a 30% relative distribution, but the trend has been declining since 2024-Q3. Preliminary data for 2025-Q1 (not shown here) supports this, suggesting that Poetry might be surpassed by Hatch in 2025, which showed a remarkable growth last year.
- Flit is the only build backend in this analysis whose absolute and relative numbers decreased in 2024. With a 5% relative distribution, it underlines the dominance of Setuptools, Poetry, and Hatch over the remaining build backends.
The script for downloading and analyzing the data is available in my GitHub
repository. If someone has insights or examples on implementing
the Git v2 protocol to download the pyproject.toml file given the repository
URL and its hash, I’d love to hear from you!

